We Think in Systems,
Not Just Software.
Most agencies build what you ask for. We figure out what your business actually needs, then engineer it to work reliably in the real world. That is the difference between a vendor and a partner.
Our StoryWe look for intelligent automation opportunities in every project so the software we ship does more with less effort over time.
We scope every engagement to specific business outcomes. Reduced costs, faster cycles, higher conversion. Those are the numbers we care about.
Testing, monitoring and observability are part of our standard process, not extras we add at the end when the budget runs out.
We work inside your tools, your repo and your sprint. Your stakeholders talk to our engineers directly without account managers in the middle.
Full Spectrum Technology Services
We cover everything from intelligent AI systems to high performance web and mobile products, so you work with one trusted team instead of juggling multiple vendors.
AI Development
We integrate large language models, build conversational AI, implement computer vision, and deploy generative AI features that work reliably in production at any scale.
Explore ServiceMachine Learning
Custom models, training pipelines, MLOps infrastructure, and predictive analytics that turn your raw data into real competitive advantage.
Learn MoreData Science
Exploratory analysis, BI dashboards, predictive modelling, and data storytelling that helps leadership make confident, informed decisions.
Learn MoreData Engineering
Robust ETL pipelines, cloud data lakes, warehouses, and real time streaming architectures built on Spark, Kafka, Airflow, and dbt.
Learn MoreWeb App Development
Custom, scalable web applications built with React, Next.js, and Node.js that are fast, secure, and work beautifully on every device.
Learn MoreMobile App Development
Native iOS, Android, and cross platform apps using Flutter and React Native that feel polished and perform at speed in real user hands.
Learn MoreIT Outsourcing
Dedicated development teams and staff augmentation that plug into your workflow from day one, delivering results at competitive rates without compromise.
Learn MoreBuilt for Your Industry
We understand the workflows, compliance requirements, and growth pressures that vary by sector. Our AI solutions are shaped around your industry from day one.
Healthcare
HIPAA-aware AI for patient apps, diagnostics support, and clinical workflow automation.
FinTech
Fraud detection, risk scoring, document intelligence, and AI-powered financial products.
E-Commerce
Smart search, personalised recommendations, visual discovery, and inventory forecasting.
Logistics
Route optimisation, demand forecasting, warehouse automation, and supply chain visibility.
HR and HRTech
AI-assisted recruiting, employee engagement tools, and people analytics dashboards.
Work We Are Proud Of.
Results That Prove It.
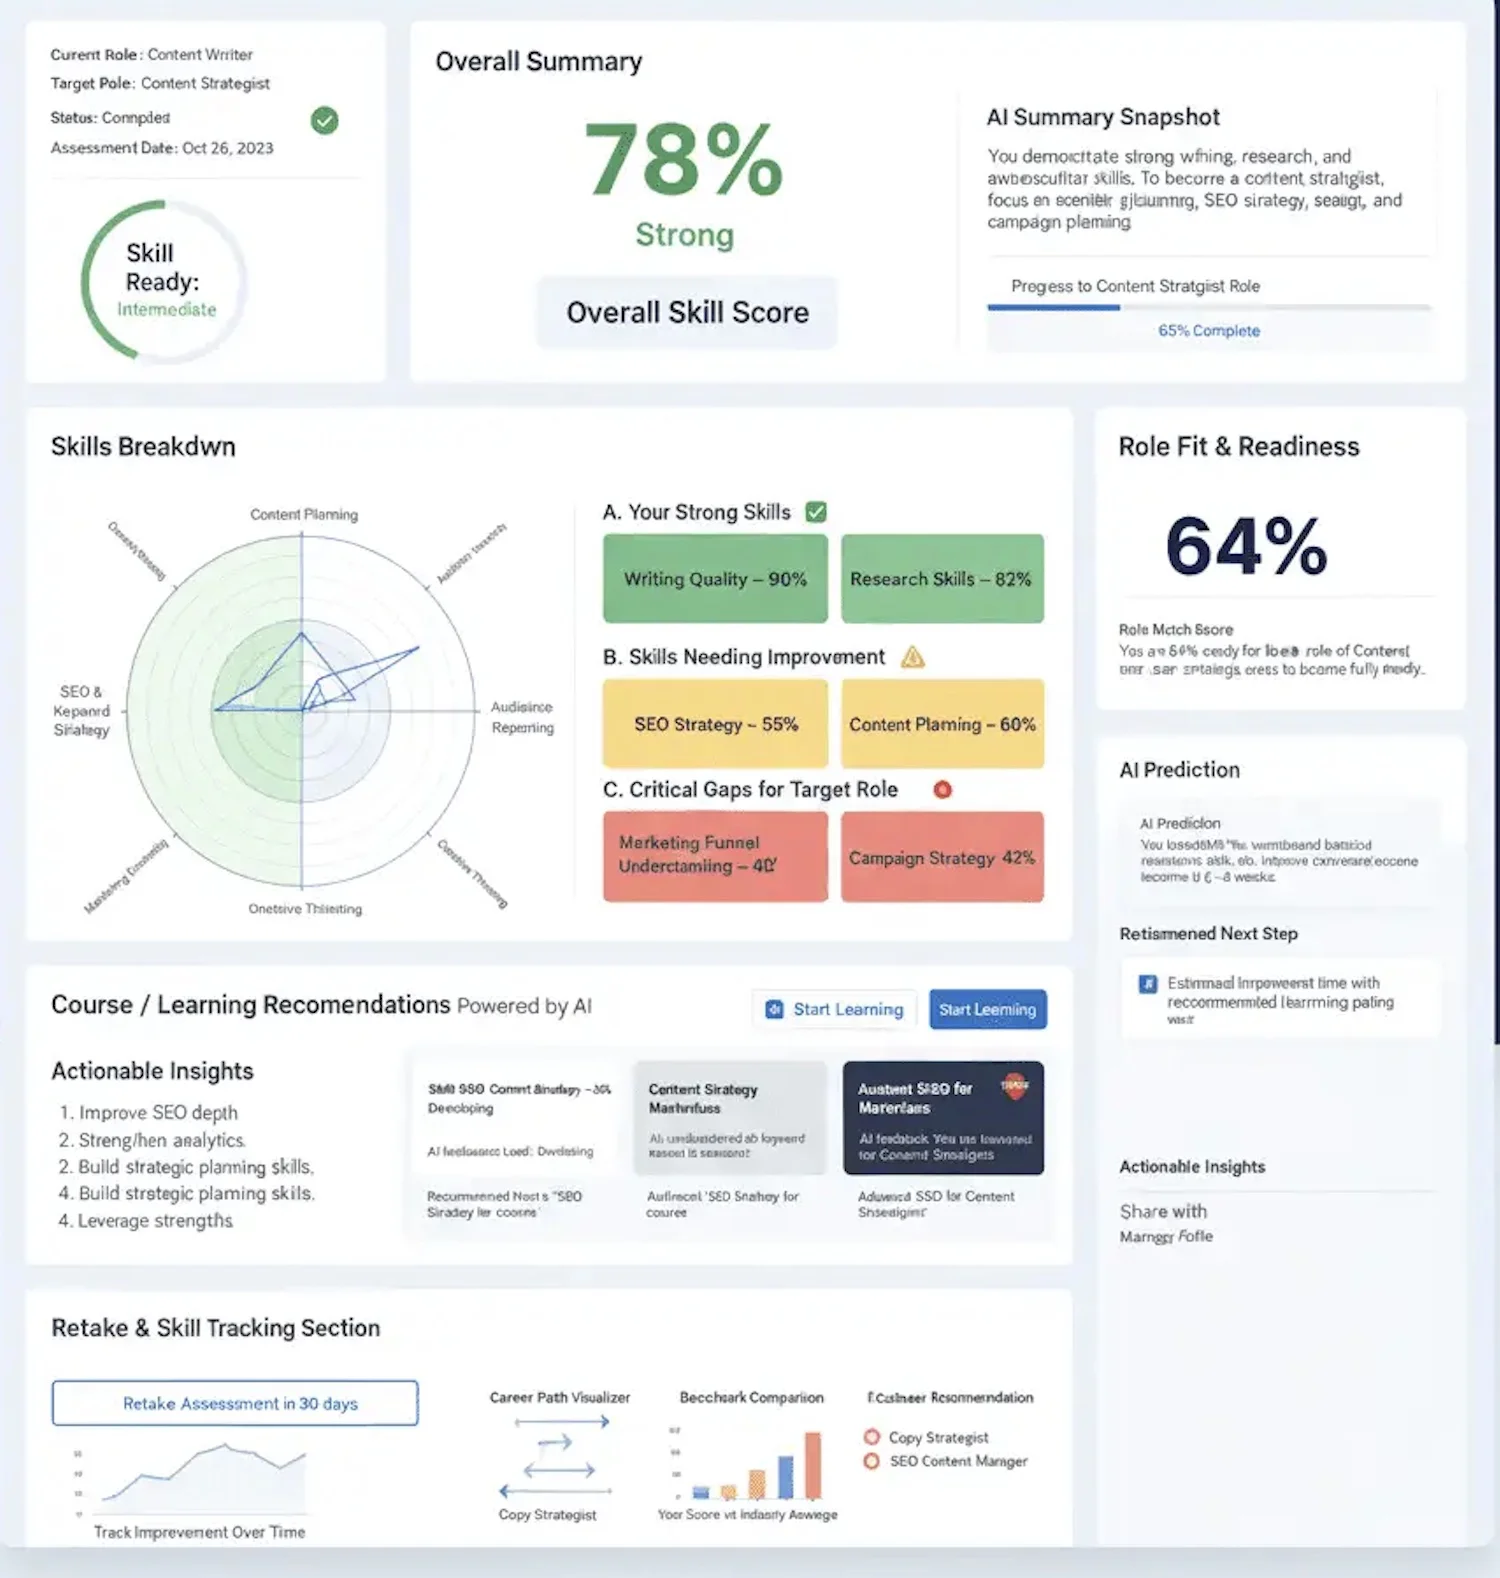
ClearMetrics: AI Skill Assessment Platform
An AI-powered platform that maps role readiness, identifies capability gaps, and delivers personalised learning recommendations so professionals know exactly what to work on next.
View Case Study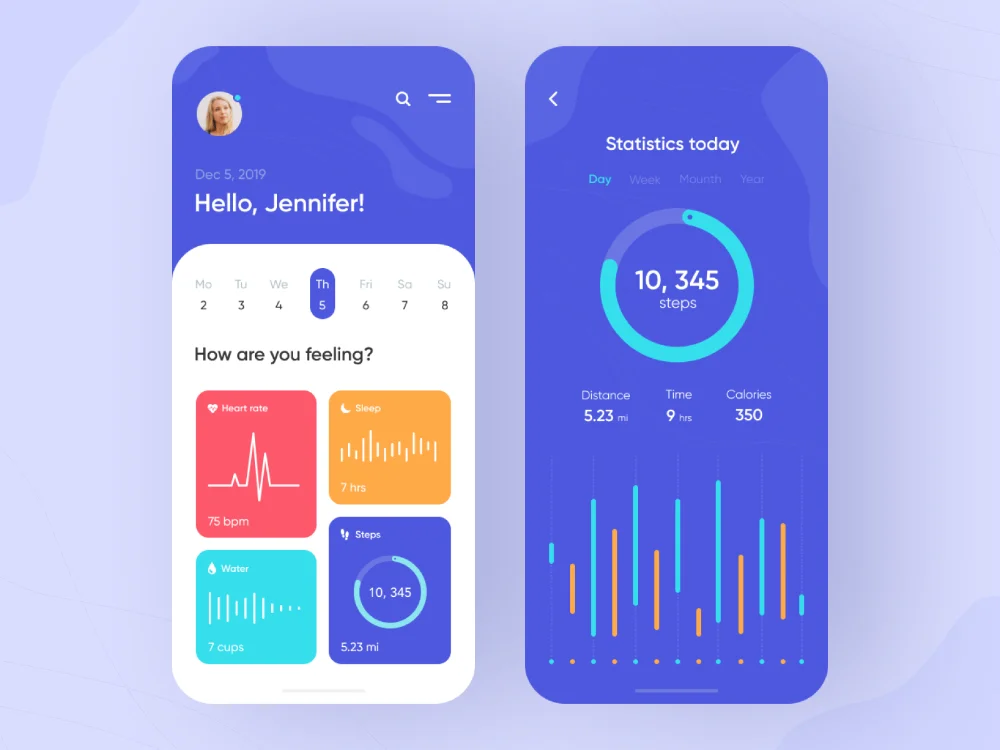
HealthTrack: Health and Fitness App
A complete health companion for iOS and Android covering nutrition, workouts, vitals monitoring, sleep tracking, and live doctor consultations all in one place.
View Case Study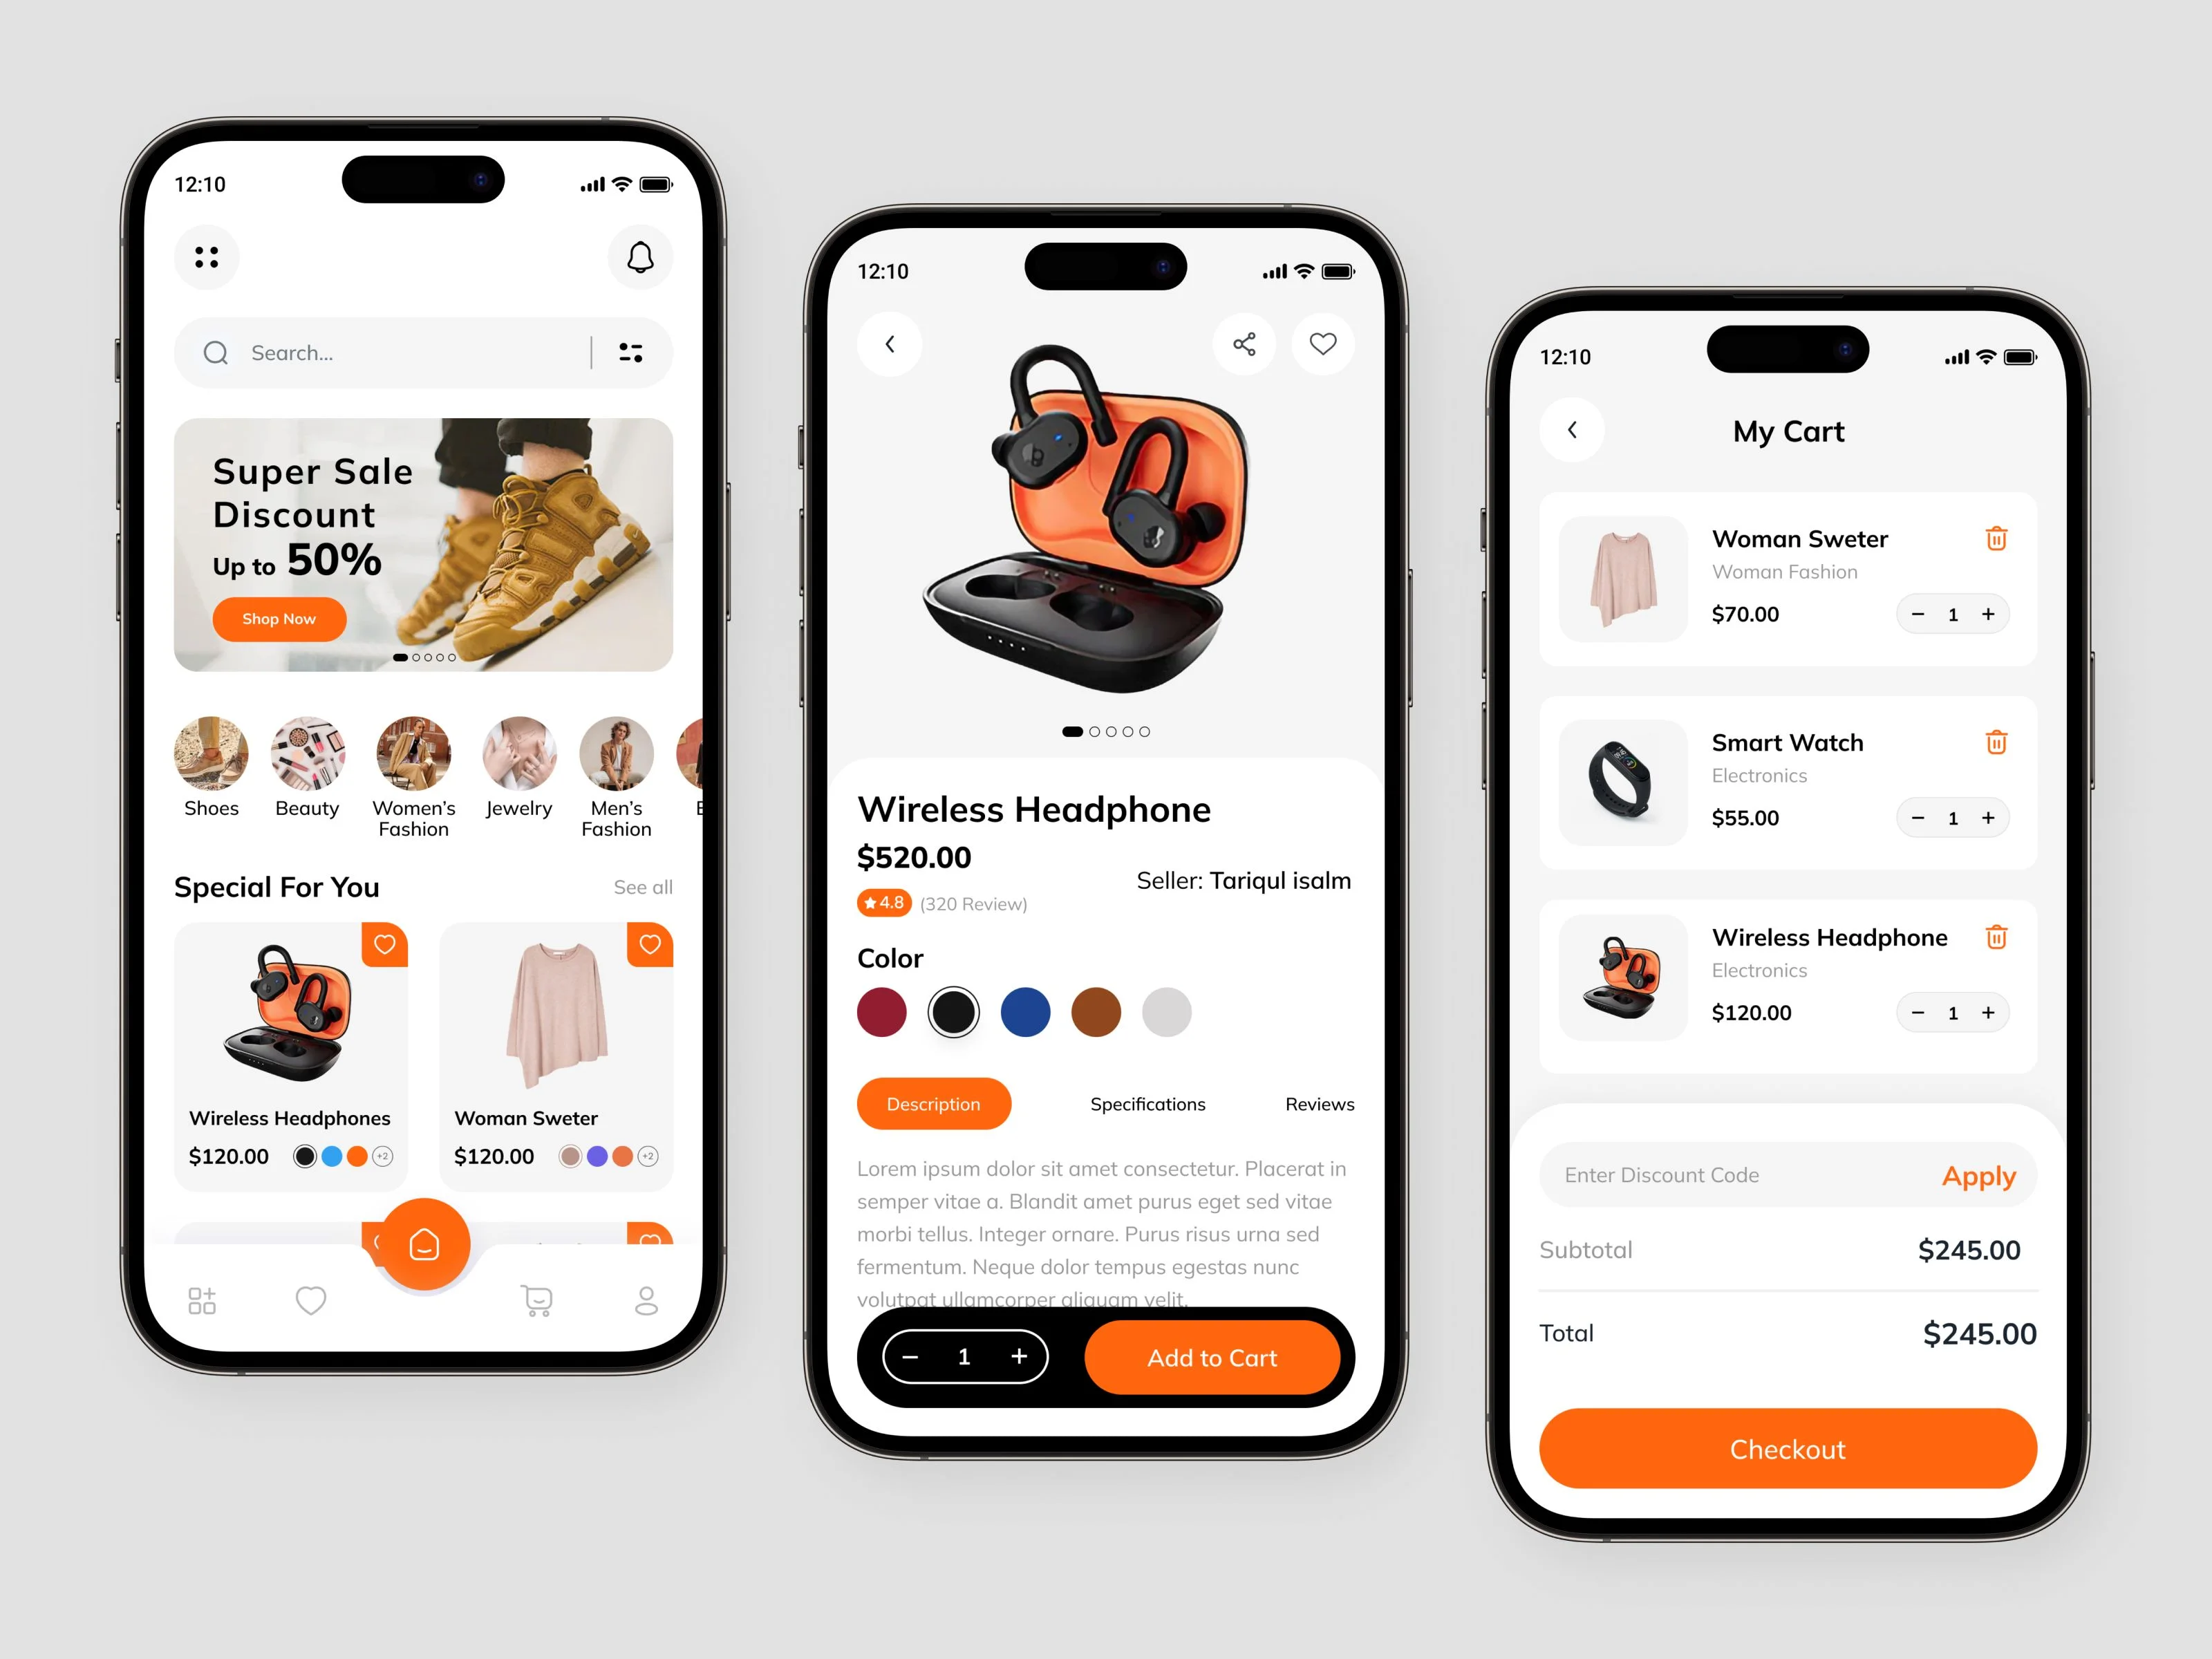
ShopHub: E-Commerce Marketplace, USA
A scalable US marketplace connecting shoppers with local sellers across clothing, electronics, and home essentials with AI recommendations and a companion mobile app.
View Case StudyTechnology We Build With
We work with the leading cloud providers, AI labs and infrastructure platforms so your product runs on technology that is proven, scalable and here to stay.
Numbers from
real client projects.
These are not marketing estimates. They come from projects we shipped, clients who came back, and results that held up after launch.
See Our WorkReturn on investment
On average our clients see a 3x return on their technology spend within the first year, measured against their own baselines.
Faster to market
Compared to their previous vendors, clients ship 40% sooner on average because we front-load planning and avoid costly mid-project pivots.
Clients who come back
98% of clients have either worked with us again or referred us to someone they know. That is the only satisfaction metric we track.
Projects shipped
Across AI, web, mobile and data engineering, for clients ranging from early-stage startups to established enterprise teams across the globe.
The tools behind
the products we build.
What we are actually good at
Ten years of building gives you depth you cannot fake. Here is where our team has spent the most time and where we can genuinely move the needle for your business.
Artificial Intelligence
Deep expertise across the AI spectrum, from classical machine learning to modern large language models, applied to real world business problems with measurable outcomes.
Data at Scale
We design and build data architectures that can handle millions of events per second, giving your teams the reliable, fast data they need to make decisions confidently.
Product Engineering
End to end product development across web and mobile, with a focus on performance, accessibility, and the kind of user experience that turns first-time visitors into loyal customers.
Security and Compliance
Every system we build is designed with security from the ground up. We follow industry best practices and stay ahead of emerging threats so you can ship with confidence.
Dedicated Teams
Whether you need a single senior engineer or a full squad, we assemble the right team fast and ensure they are aligned with your culture, tools, and delivery standards from day one.
Continuous Innovation
Our team stays at the cutting edge through ongoing research, open source contributions, and internal innovation sprints so that every new project benefits from the latest advances.
Here Is
What Makes Us Different
We have worked with a lot of clients who came to us after a bad experience elsewhere. These are the things they consistently tell us they noticed first.
You talk to engineers, not account managers
The person you message on Slack is the person writing the code. No translation layer, no lost context, no waiting two days for someone to relay a question.
We tell you when something is a bad idea
If a feature will not help your users or a technical approach will cost you later, we say so. Honest pushback early saves everyone a much harder conversation at the end.
Scope changes get documented, not ignored
When requirements change, we update the scope in writing, discuss the impact on timeline and cost, and get your sign-off. No surprises on invoice day.
Everything we build is yours, completely
Full source code, full IP, full documentation. No vendor lock-in, no proprietary platforms that only we can maintain. You can take it anywhere.
A Process Built for Clarity
A proven five step engagement model that keeps you informed, in control, and confident at every stage of your project from first conversation to post-launch growth.
What clients say
after working with us
A few words from people who have been through a project with us and are happy to share how it went.
Ideas, Guides, and
Industry Perspectives

How Much Does AI Development Cost in India? (2026 Guide)
A complete breakdown of AI development costs in India in 2026. Chatbots, ML models, LLM integration, and full AI products.…
Read Article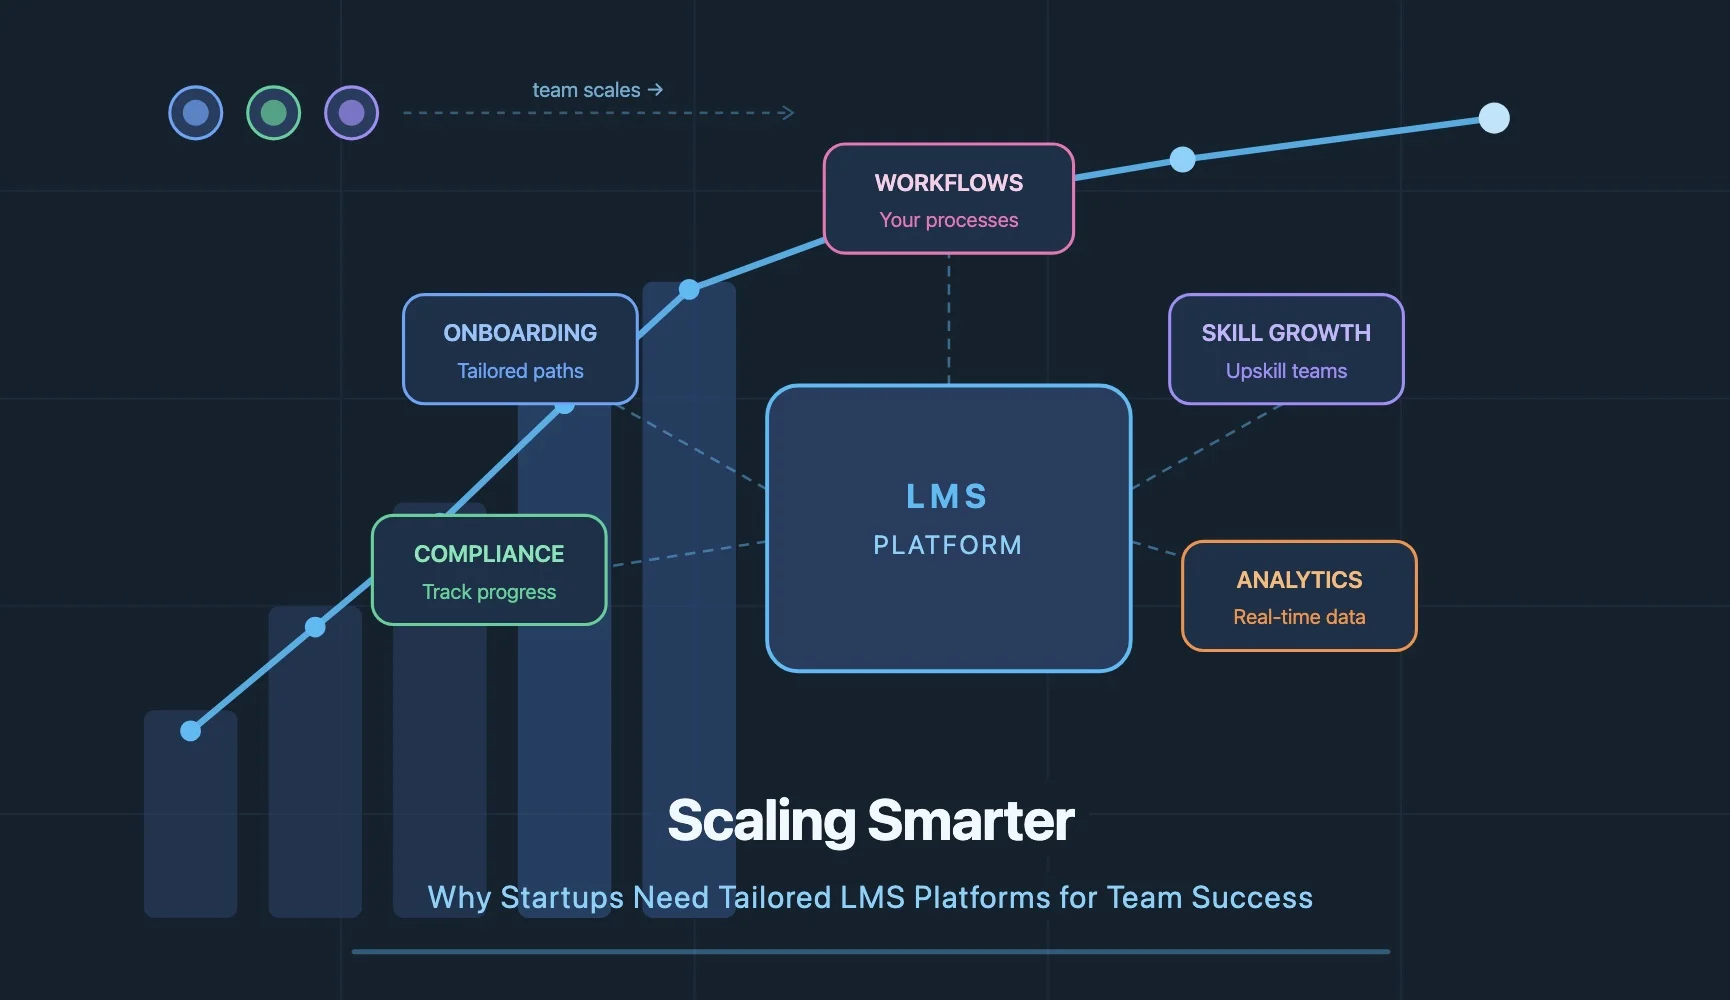
Scaling Smarter: Why Startups Need Tailored LMS Platforms for Team Success
Most startups do not have a training problem. They have a scaling problem. A tailored LMS built around your actual…
Read Article
How AI Development Can Transform Your Business in 2026
AI development is transforming how businesses operate in 2026. Five areas creating real value: process automation, smarter decisions, personalisation at…
Read ArticleLet's Talk About
Your Next Project
Whether you have a clear vision or just an early idea to explore, we would love to hear from you. Drop us a message and we will get back to you within one business day.